It’s one of those days when I arrive at the office with my iced coffee and I have to carry it up 5 flights because the elevator is broken.
It’s one of those days when I arrive at the office…
Status
Reply
It’s one of those days when I arrive at the office with my iced coffee and I have to carry it up 5 flights because the elevator is broken.
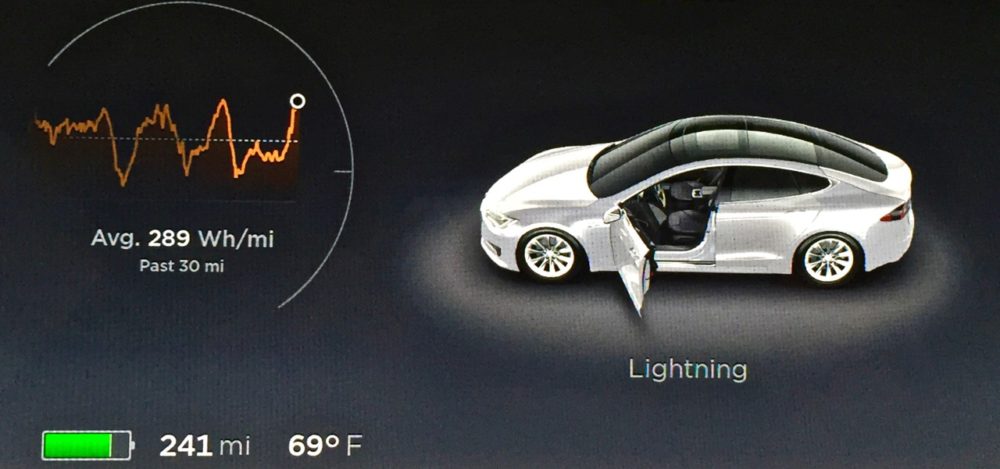
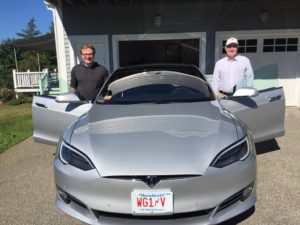
My first international Tesla trip and my initial big data geek take on the data we recorded from it. carlhowe.com/blog/boston-to…

Odometer: 2,538 miles
Well, Lightning performed flawlessly on our trip to Montreal and back. Unfortunately, my logging program didn’t perform nearly as well. You see, we received data from the car just fine while it was in the US. But when we reached Canada, all of a sudden, the car was no longer visible to the Web. My logger wasn’t really prepared for this eventuality, so it threw and exception and exited.
The other bug I had in my logger was that I vary the polling rate based on whether the car is engaged or not. When the car is parked, I only poll it every 20 minutes. When it is moving, I poll it every minute. What I hadn’t really accounted for though was when it was charging, when it would be nicer to have more granular monitoring of how fast it was charging and at what rate. I’m going to change that for the next go-around.
All that said, here’s an R ggplot of the data that I was able to collect on our trip up to the Canadian border:

The blue data points show the speed of the car while the red ones show the current draw. The lines are regressions plotted over data point for that metric. You can see the slow polling when the car was charging by those bars showing a few hundred amps going into the car; the current actually varies a lot more dynamically than I’ve shown, but my program just didn’t bother to collect the data.
You can see our long stop-and-go traffic wait at the Canadian border is shown at the end of the graph by what is essentially a period of about half an hour of zero speed and near zero current. You can also see some gaps in the coverage leading up to this point as we passed through areas of Vermont where there wasn’t great cellular coverage.
We can gain a bit more insight by pulling apart the variables into their own graphs using a technique called faceting. Here’s that graph:

The speed graph is about what you’d expect; the first hour was a bit erratic as we escaped Boston area traffic, but as the day wore on, we held a pretty constant 70 mph or so using Autopilot.
What’s more interesting is the current graph: note that it doesn’t map directly to the speed. This feature, of course, is due the fact that the road to Canada is not flat and requires us to traverse the Green Mountains along the way. You can see some pretty big positive battery current spikes that come from the regenerative braking on the descent from some of those mountains.
With these lessons learned, I’ll be updating my logging program for our next trip up to Maine to capture data more reliably. I should have some more data and pretty graphs to post around the end of the month.
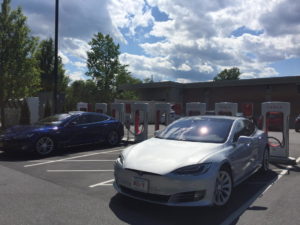
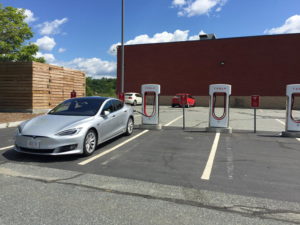
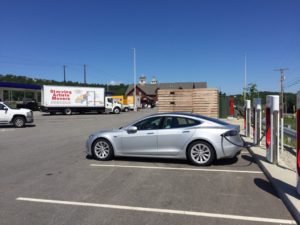
One final note: Canadians seem to love Teslas and electric cars in general. Not only did we get thumbs-up salutes from other drivers and curious folks coming over to look at the car, but I was really impressed at the charging stations in Canada. Here’s a photo of the Supercharger in Magog, Quebec:

As you can see from the photo, Magog isn’t exactly in an urban area, but not only did it sport 8 Supercharger stalls, it had another 8 or so J1772 chargers AND a high-speed CHAdeMO charger. It was most impressive.
Another short unscheduled stop in S Burlington to guarantee 20% reserve at destination if we are delayed at border. https://t.co/OeAwxHmWaq
West Lebanon supercharger on schedule. Grabbing lunch at Panera Bread, which will take longer than charging. https://t.co/zrO0ciZzxc
Robert wanted a Coke so we made an unscheduled at the Hookset supercharger. https://t.co/i7zFqzge2K
Off on our road trip to Montreal! https://t.co/2a0xeLYK3O

Route between Stow, MA and Montreal, Quebec, Canada
Odometer: 1840 miles
On Monday, we’re taking Lightning on our first international road trip from Stow, Massachusetts to Montreal, Quebec, where I’m dropping my son to travel to Japan. According to evtripplanner.com, this will be a roughly 312 mile trip each way. Even with Lightning’s 90kWh battery, the trip will require at least one recharging stop, which we’ve currently planned for West Lebanon, New Hampshire.
 Unlike our prior road trip to Maine, this route really epitomizes Elon Musk’s vision for what an electric car trip should be like. While we have the luxury of a nearly 300 mile range with Lightning, we have no fewer than 3 superchargers along our route AND we have a supercharger available in Montreal when we get there. No one driving a Tesla would have any range anxiety on this route. In fact, as you can see from the circles on the map to the right, any electric car with 100 miles of range would handily make the trip using just Superchargers. And just like in a gasoline car, one could easily do this trip with no planning whatsoever; just point the car in the direction you want to go, and follow the in-car Navigation directions to Superchargers when the planning software tells you to.
One other convenient aspect is that Montreal itself is very EV-friendly. The hotel where we are staying has free parking for electric vehicles, and Montreal boasts a 12-stall Supercharger station and another 2 stalls at one of Canada’s largest Tesla dealerships. For those not in Teslas, Montreal also has an array of J1772 charging stations as shown in the screenshot below. 
We’re charging the battery to 95% capacity today off our solar panels which should give us about 275 miles of range. We will be climbing a bit into the mountains, so we will likely see less than that, but our Supercharger top-up in West Lebanon will easily get us to Montreal with between 50-100 miles of range left. Should we encounter rain or expend too much energy in the mountains, we can always top up again in Burlington, Vermont.
EVtripplanner.com estimates we’ll be driving about 5 hours each way, plus about 40 minutes of charging time, during which we’ll probably get a bite to eat in West Lebanon. I’ll be running my trip logger at home during the trip to record what our actual mileage and charging numbers turn out to be. Our current trip plan estimates we’ll consume about 103 kWh each way. Because our Supercharger use is free, our only vehicle costs for this entire 630 mile trip will be about $5 in tolls to use the Everett Turnpike in New Hampshire.
I’ll update the blog with tweets and photos as we drive up on Monday and back on Tuesday. This should be a fun trip.
Apple’s new circular HQ is big enough to see from space–or at least a high flying airplane. https://t.co/eyS7yHU1vO


Odometer: 1745 miles
One of the cool things about having an intelligent car with a built in LTE connection is the ability to ask it to provide information about itself. Tesla provides both iPhone and Android apps that allow owners to unlock the car, flash the lights, and monitor charging. However, as a Big Data geek and recovering data scientist, I’m more intrigued by recording information about the car so that I can monitor its performance and state over time.
So to begin, a quick shoutout to the developers who have made it possible for owners to monitor their Teslas:
So with all this work as a foundation, as a big data guy, I had to write my own data logger.
Just to be clear, what this API does is not monitor the car itself directly; instead, it communicates with Tesla’s servers that regularly monitor the car. So there’s a level of insulation between user code and the car that I am quite thankful for. I’d really hate to see someone’s buggy code decide to run my car’s stereo system volume up to 11, for example.
My current Tesla data logging program shares a Raspberry pi with a homegrown weather and solar panel monitoring system. Because I started with Rob M.’s example code, it’s written in Python and it’s pretty simple minded. What it does is poll my Tesla every 20 minutes and log its state into a .csv file. If it ever notices the shifter state is not None, it ups the logging rate to every minute until the shifter goes back to None again.
With the data in .csv form, I then can use R and ggplot2 to generate not only line graphs, but to apply a smoothing regression to the data to make it easier to see trends, as shown in the graphic at the top of this post. The blue line in that graph is the car’s speed, while the red line is the battery current, which goes negative when I’m driving the car and goes positive when it is being charged.
This is all pretty rudimentary stuff at present, but I hope to make it more sophisticated as time goes on. At the very least, I’ll have a nice hard baseline of data about driving efficiency and performance when the car was new to compare with as the car ages.
I’ll be driving Lightning to Montreal and back August 8 and 9, so I’ll be particularly interested to see the logs from that 700 mile trip. I’ll share what I learn after I’ve had a chance to analyze the data.