Odometer: 2,538 miles
Well, Lightning performed flawlessly on our trip to Montreal and back. Unfortunately, my logging program didn’t perform nearly as well. You see, we received data from the car just fine while it was in the US. But when we reached Canada, all of a sudden, the car was no longer visible to the Web. My logger wasn’t really prepared for this eventuality, so it threw and exception and exited.
The other bug I had in my logger was that I vary the polling rate based on whether the car is engaged or not. When the car is parked, I only poll it every 20 minutes. When it is moving, I poll it every minute. What I hadn’t really accounted for though was when it was charging, when it would be nicer to have more granular monitoring of how fast it was charging and at what rate. I’m going to change that for the next go-around.
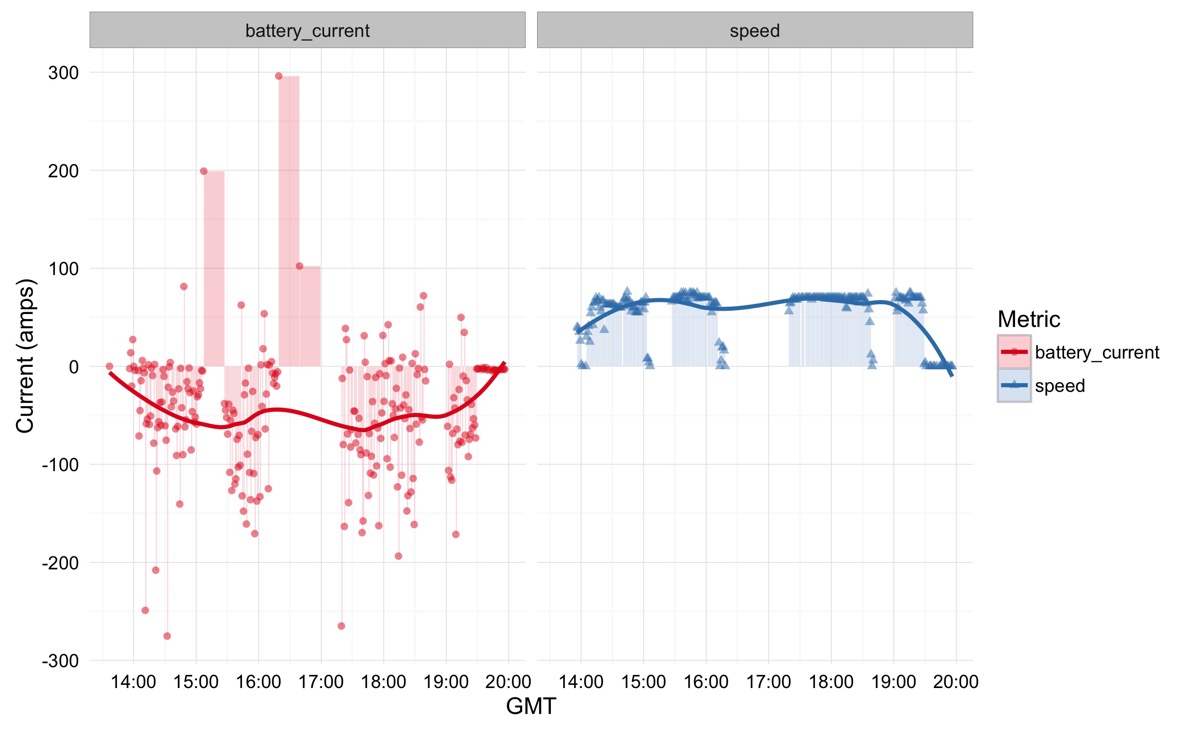
All that said, here’s an R ggplot of the data that I was able to collect on our trip up to the Canadian border:

The blue data points show the speed of the car while the red ones show the current draw. The lines are regressions plotted over data point for that metric. You can see the slow polling when the car was charging by those bars showing a few hundred amps going into the car; the current actually varies a lot more dynamically than I’ve shown, but my program just didn’t bother to collect the data.
You can see our long stop-and-go traffic wait at the Canadian border is shown at the end of the graph by what is essentially a period of about half an hour of zero speed and near zero current. You can also see some gaps in the coverage leading up to this point as we passed through areas of Vermont where there wasn’t great cellular coverage.
We can gain a bit more insight by pulling apart the variables into their own graphs using a technique called faceting. Here’s that graph:

The speed graph is about what you’d expect; the first hour was a bit erratic as we escaped Boston area traffic, but as the day wore on, we held a pretty constant 70 mph or so using Autopilot.
What’s more interesting is the current graph: note that it doesn’t map directly to the speed. This feature, of course, is due the fact that the road to Canada is not flat and requires us to traverse the Green Mountains along the way. You can see some pretty big positive battery current spikes that come from the regenerative braking on the descent from some of those mountains.
With these lessons learned, I’ll be updating my logging program for our next trip up to Maine to capture data more reliably. I should have some more data and pretty graphs to post around the end of the month.
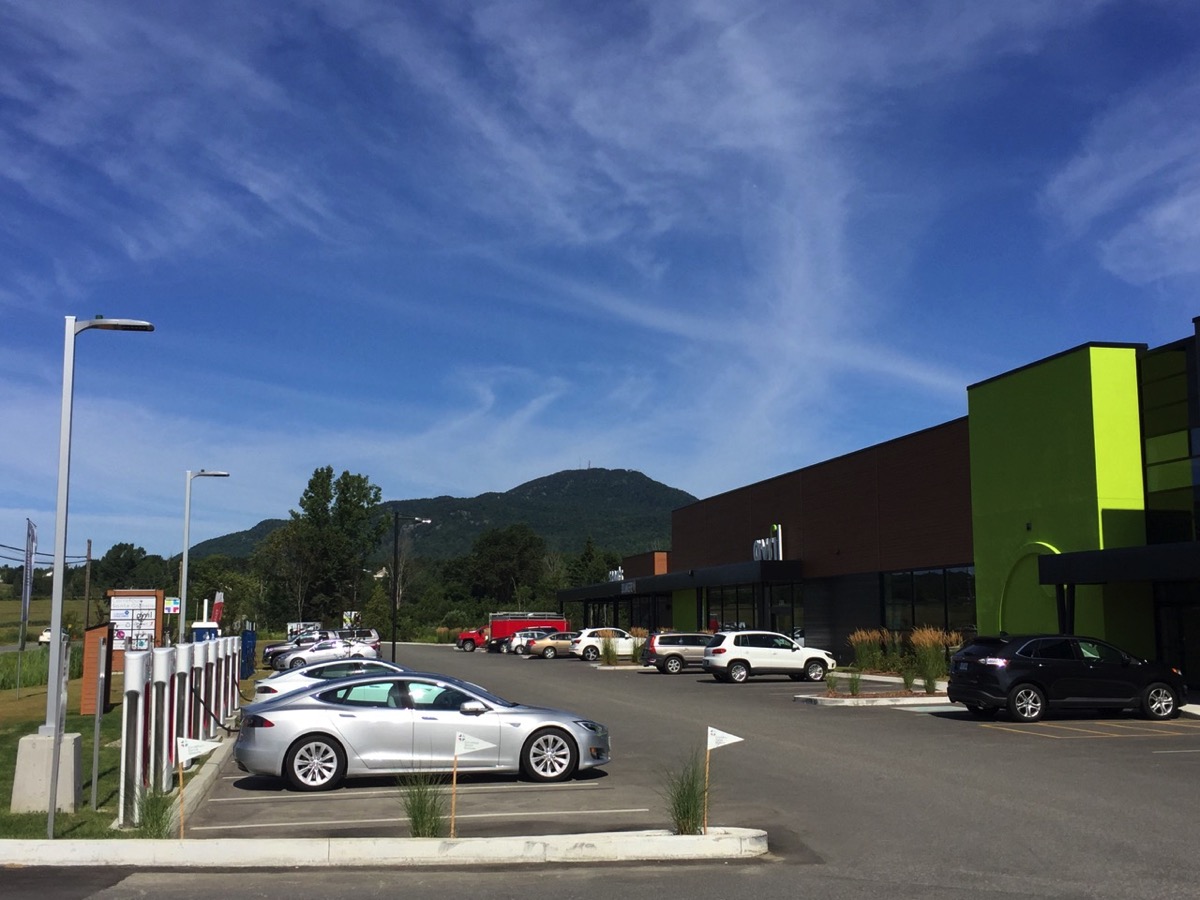
One final note: Canadians seem to love Teslas and electric cars in general. Not only did we get thumbs-up salutes from other drivers and curious folks coming over to look at the car, but I was really impressed at the charging stations in Canada. Here’s a photo of the Supercharger in Magog, Quebec:

As you can see from the photo, Magog isn’t exactly in an urban area, but not only did it sport 8 Supercharger stalls, it had another 8 or so J1772 chargers AND a high-speed CHAdeMO charger. It was most impressive.
